Covid Sound
Tools: Processing IDE, Java, Excel, Illustrator, OSC platform
A sonic data visualization of active cases and mortality rates across India's states and union territories from the onset of COVID-19 to March 2022, created using OSC and sound synthesis. This project was featured in the Museum of Contemporary Digital Arts Summer Show 2022.

Interactive video link
Featured in the Museum of Contemporary Digital Arts (MoCDA) Summer Show 2022
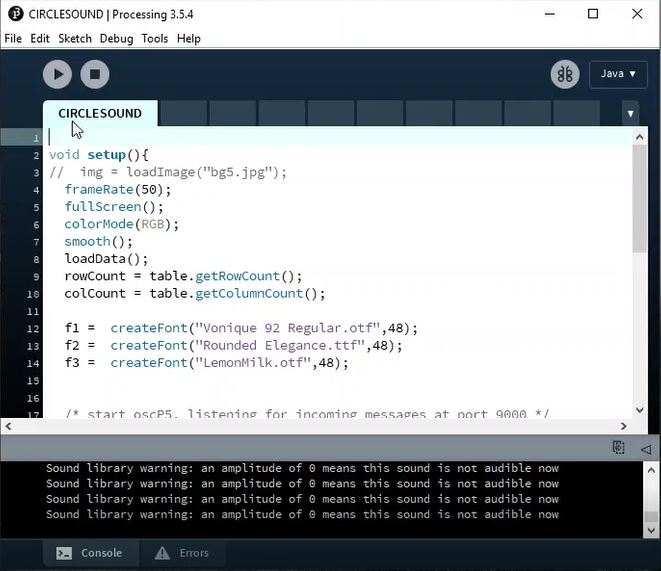
The dataset was downloaded from a source online and loaded into the processing code. Mapped the cases and deaths code data to the frequency and amplitude of Sin Oscillator and Tri Oscillator respectively. Color-coded each state in rainbow order. The date and State name were in bold white color as the date passes by for each state.
Tools & Software used
Tools & Software used
- OSC platform
-
Processing - IDE For Java CODE
-
Excel
-
Adobe Illustrator / Fonts